Table of contents
Open Table of contents
0. Preparation
Objective
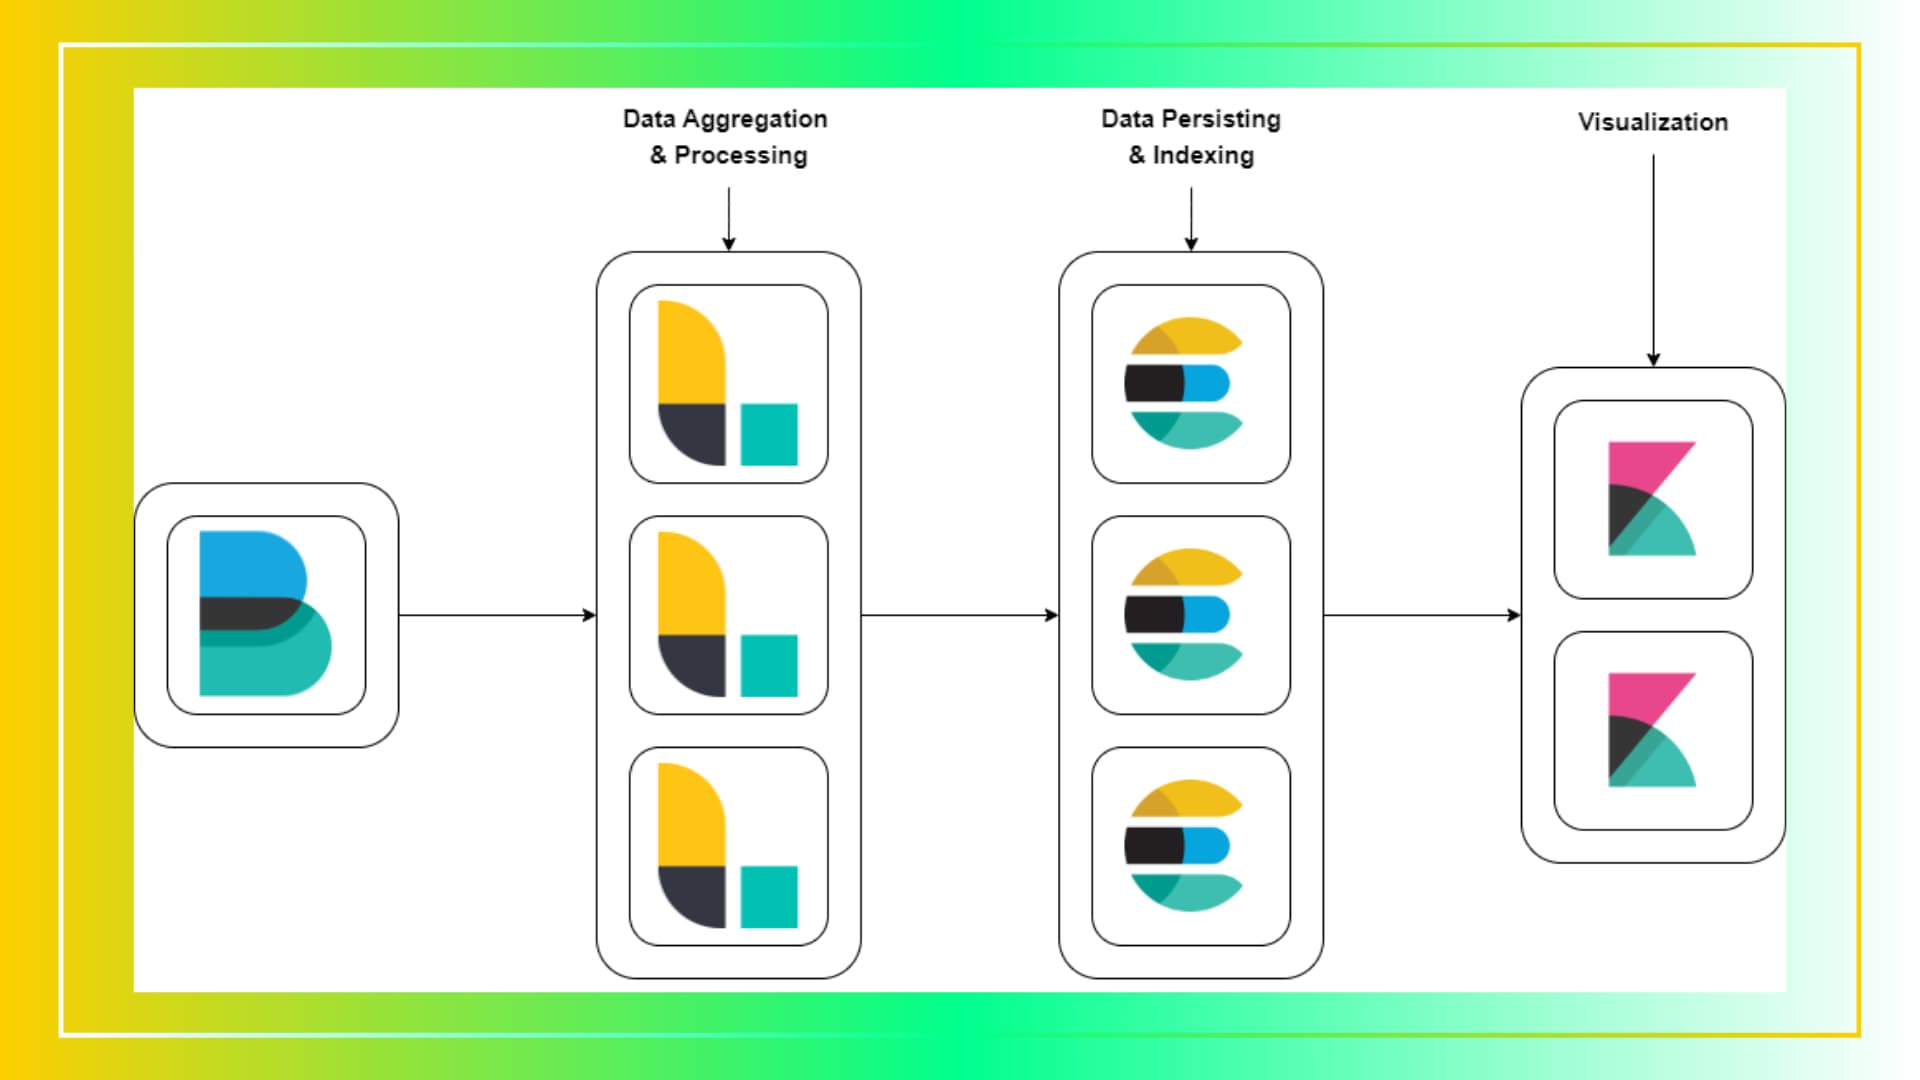
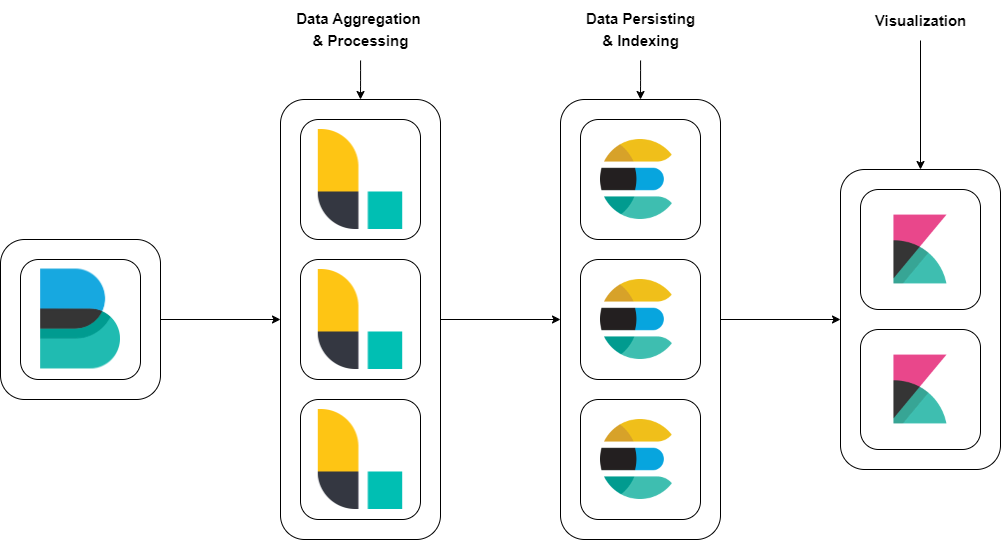
The primary goal of this project is to implement a high-availability ELK stack (Elasticsearch, Logstash, Kibana) to ensure uninterrupted access and reliable performance for log management and data analysis. The focus is on configuring the ELK stack to withstand node failures and maintain continuous service.
Technologies Involved
Elasticsearch: A distributed, RESTful search and analytics engine capable of addressing a growing number of use cases. It is the core of the Elastic Stack, which provides centralized logging and analytics.
Logstash: A server-side data processing pipeline that ingests data from multiple sources simultaneously, transforms it, and then sends it to a “stash” like Elasticsearch.
Kibana: A data visualization dashboard for Elasticsearch, providing insights and analytics into the data stored in Elasticsearch indices.
Filebeat: A lightweight shipper for forwarding and centralizing log data. Installed as an agent on your servers, Filebeat monitors the log files or locations that you specify, collects log events, and forwards them to Elasticsearch or Logstash for indexing.
1. Provisioning VMs
Name and Region/Zone
- Enter a name for your VM instance (e.g.,
node-1) and select the region and zone where you want the VM to be hosted (e.g.,us-central1-a).
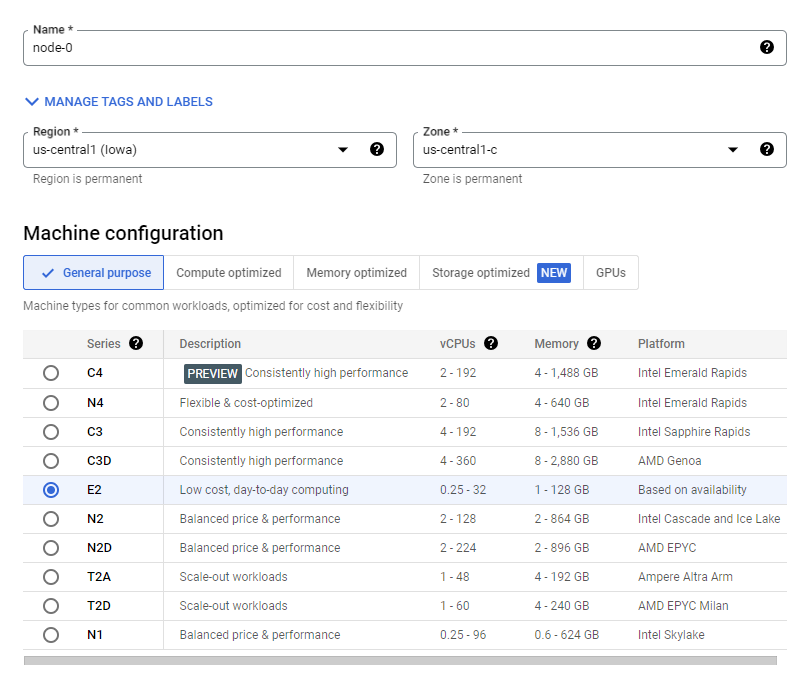
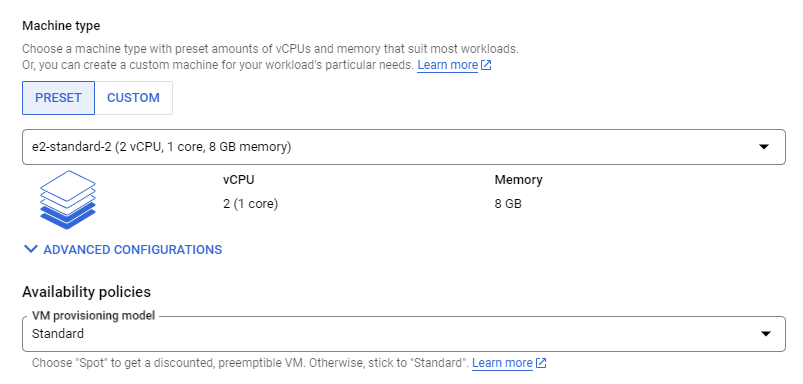
Machine Configuration
- Choose the machine type
e2-standard-2(2 vCPUs, 8 GB memory).
Firewall Rules
- Select the firewall rules to allow HTTP and HTTPS traffic if needed.
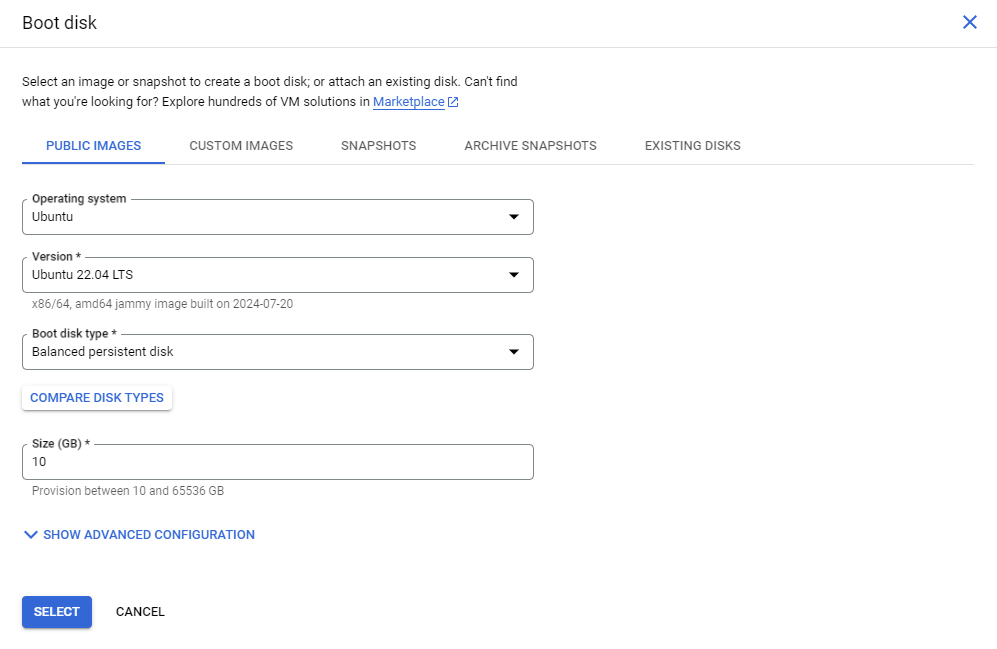
Boot Disk
- Click on Change to configure the boot disk.
- In the OS Images tab, select Ubuntu.
- Choose Ubuntu 22.04 LTS.
- Set the disk size to 10 GB.
VM Specifications
| VM Name | IP Address | Instance Type | Storage | Operating System | Hostname | Ram |
|---|---|---|---|---|---|---|
| node-1 | 10.128.0.2 | e2.standart-2 | 10GB | Ubuntu 22.04 LTS | node-1 | 8GB |
| node-2 | 10.128.0.3 | e2.standart-2 | 10GB | Ubuntu 22.04 LTS | node-2 | 8GB |
| node-3 | 10.128.0.4 | e2.standart-2 | 10GB | Ubuntu 22.04 LTS | node-3 | 8GB |
Security Group/Firewall Configuration
Open the following ports for each VM:
- Elasticsearch: 9200
- Logstash: 5044
- Kibana: 5601
2. Java Installation
Java is required for Elasticsearch to run. The steps below outline how to install Java on your VMs.
Update the Package List
sudo apt update
Install OpenJDK 11
sudo apt-get install default-jre
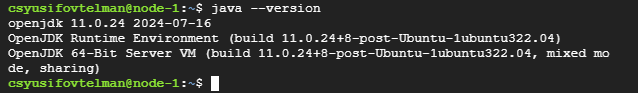
Verify the Installation
java -version
3. Elasticsearch
Elasticsearch is a distributed search and analytics engine capable of handling large volumes of data.
Installation
Adding the Elasticsearch GPG key and repository
sudo apt update

curl -fsSL https://artifacts.elastic.co/GPG-KEY-elasticsearch | sudo gpg --dearmor -o /usr/share/keyrings/elastic.gpg

echo "deb [signed-by=/usr/share/keyrings/elastic.gpg]https://artifacts.elastic.co/packages/7.x/apt stable main" | sudo tee -a /etc/apt/sources.list.d/elastic-7.x.list
Installing Elasticsearch
sudo apt-get update
sudo apt-get install elasticsearch -y
Configuration
Editing the Elasticsearch configuration file
sudo nano /etc/elasticsearch/elasticsearch.yml
Nano
cluster.name: high-a-elk
node.name: node-1
network.host: 0.0.0.0
http.port: 9200
path.data: /var/lib/elasticsearch
path.logs: /var/log/elasticsearch
discovery.seed_hosts: ["10.128.0.2", "10.128.0.3", "10.128.0.4"]
cluster.initial_master_nodes: ["node-1", "node-2", "node-3"]
- Cluster: A group of nodes working together to store and process data.
- Node: A single server in an Elasticsearch cluster.
Starting and enabling Elasticsearch
sudo systemctl daemon-reload
sudo systemctl start elasticsearch
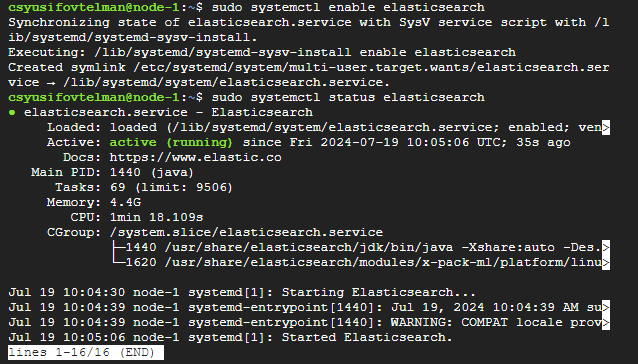
sudo systemctl enable elasticsearch
Checking the Status
sudo systemctl status elasticsearch
If Elasticsearch is running correctly, you should see something similar to this:
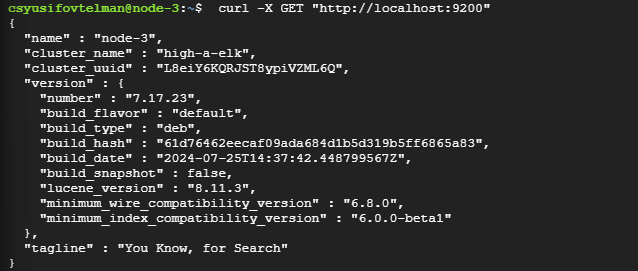
Elasticsearch should be running on port 9200. You can test it with cURL and a GET request.
curl -X GET "http://localhost:9200"
4. Logstash
Logstash: A data processing pipeline that collects and processes data from various sources and sends it to destinations like Elasticsearch.
Installation
Install Logstash
sudo apt install logstash -y
Configuration
Editing the Logstash configuration file
sudo nano /etc/logstash/conf.d/logstash.conf
Nano
input {
beats {
port => 5044
}
}

output {
elasticsearch {
hosts => ["http://10.128.0.2:9200", "http://10.128.0.3:9200", "http://10.128.0.4:9200"]
index => "%{[@metadata][beat]}-%{[@metadata][version]}-%{+YYYY.MM.dd}"
}
}
- Input Plugin: Defines where Logstash gets its data.
- Output Plugin: Defines where Logstash sends the processed data.
Starting and enabling Logstash
sudo systemctl start logstash
sudo systemctl enable logstash
Checking the Status
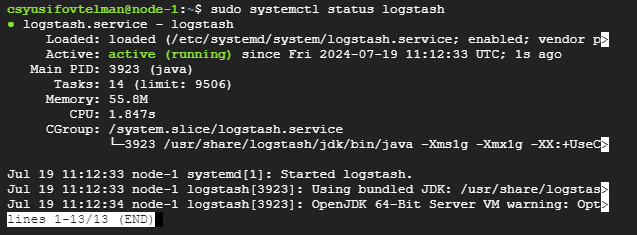
sudo systemctl status logstash
If Elasticsearch is running correctly, you should see something similar to this:
5. Kibana
Kibana: A data visualization tool used for searching and visualizing data in Elasticsearch.
Dashboard: A collection of visualizations and searches.
Visualization: Graphical representations of data.
Index Pattern: Defines which indices Kibana should use.
Installation
Installing Kibana
sudo apt install kibana -y
Configuration
Editing the Kibana configuration file
sudo nano /etc/kibana/kibana.yml
Nano
server.port: 5601
server.host: "0.0.0.0"
elasticsearch.hosts:
  ["http://10.128.0.2:9200", "http://10.128.0.3:9200", "http://10.128.0.4:9200"]
Starting and enabling Kibana
sudo systemctl daemon-reload
sudo systemctl start kibana
sudo systemctl enable kibana
Checking the Status
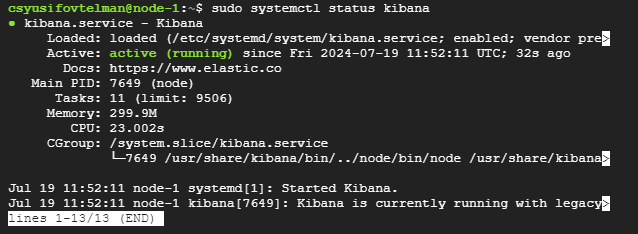
sudo systemctl status kibana
If Elasticsearch is running correctly, you should see something similar to this:
6. Cluster Validation
Verify Cluster Health
To ensure that your ELK (Elasticsearch, Logstash, Kibana) stack is highly available and can tolerate the failure of one node, follow these steps to validate and test the setup.
curl -X GET 'http://localhost:9200/_cluster/health?pretty'
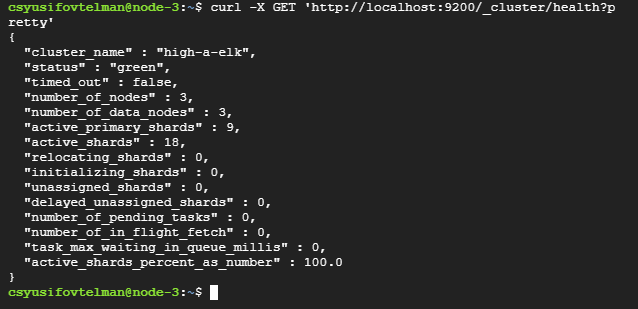
You should see a response indicating the cluster status. A healthy cluster will show "status" : "green" or "status" : "yellow" (yellow indicates some replicas are not allocated, but the cluster is functional).
Stopping One Elasticsearch Node
Next, stop the Elasticsearch service on one of the nodes to simulate a failure.
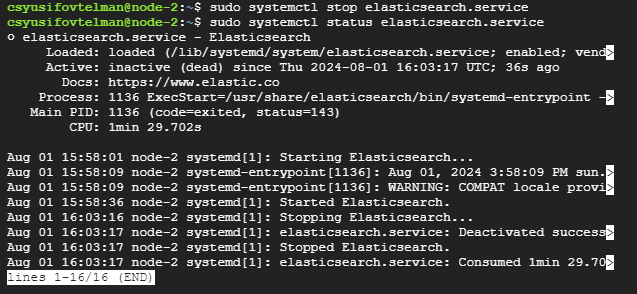
Verify Cluster Health After Stopping a Node
Check the cluster health again to see if the cluster is still operational.
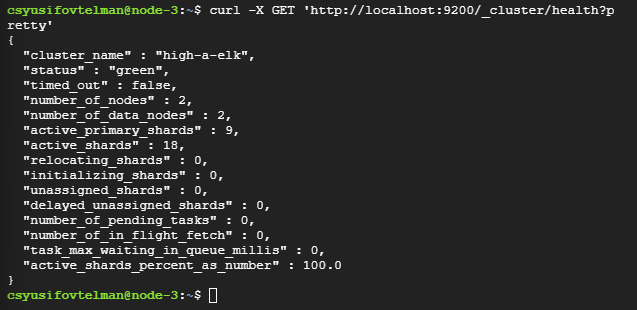
The cluster health is currently “green,” which is good and indicates that the cluster is fully functional with no unassigned shards. However, it shows that there are only 2 nodes active instead of the expected 3.
7. Filebeat
Filebeat: A lightweight shipper for forwarding and centralizing log data. It monitors log files and sends log events to Logstash or Elasticsearch.
Installation
Installing Filebeat
sudo apt-get install filebeat
Configuration
Editing the Filebeat configuration file
sudo nano /etc/filebeat/filebeat.yml
Nano
filebeat.inputs:
  - type: log
    enabled: true
    paths:
      - /var/log/*.log
      - /var/log/syslog

output.elasticsearch:
  hosts:
    [
      "http://10.128.0.2:9200",
      "http://10.128.0.3:9200",
      "http://10.128.0.4:9200",
    ]
  protocol: "http"
- Input: Defines which log files to monitor.
- Output: Defines where to send the collected log data.
Starting and enabling Filebeat
sudo systemctl enable filebeat
sudo systemctl start filebeat
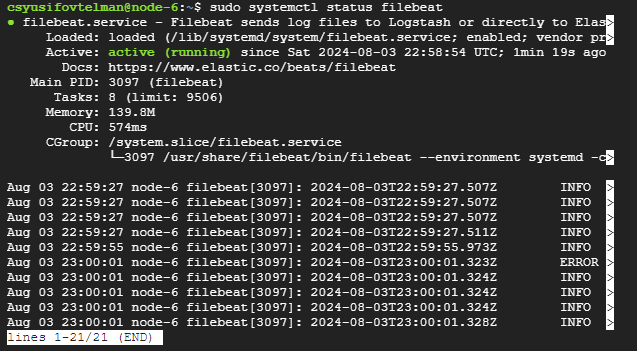
Checking the status
sudo systemctl status filebeat
8. Final Testing
Creating a Test Log Entry
For testing I will create log entry with logger command. The logger command is a utility in Unix-like operating systems that allows you to add messages to the system log. It provides a simple way to create log entries that can be handled by the system’s logging infrastructure (e.g., syslog).
logger "Test log entry from Filebeat"
Creating Index Pattern
Open Kibana:
- Navigate to your Kibana instance in your web browser, typically at
http://<your-kibana-host>:5601. Go to Management: - Click on “Management” in the left-hand menu. Create Index Pattern:
- Click on “Index Patterns” under the “Kibana” section.
- Click the “Create index pattern” button. Define Index Pattern:
- Name: Enter
filebeat-*.- This pattern matches any index that starts with
filebeat-followed by any characters (usually a date or version number). Choose Timestamp Field:
- This pattern matches any index that starts with
- Timestamp field: Select
@timestampfrom the dropdown menu. Complete Index Pattern Creation: - Click the “Create index pattern” button to finish.
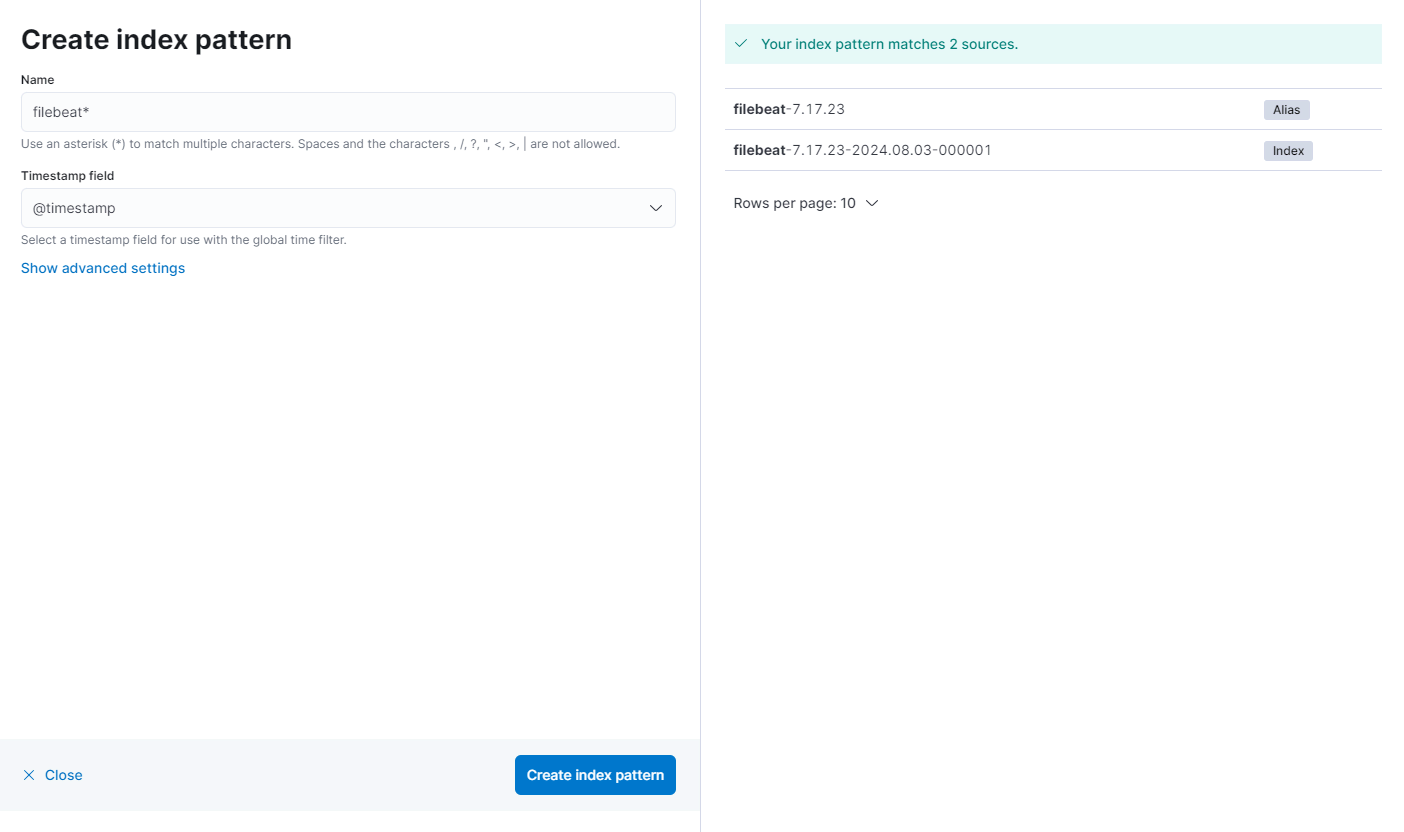
Creating index patterns in Kibana is essential for managing and querying the data stored in Elasticsearch indices.
Searching for the Test Log Entry
In the Kibana “Discover” section, use the following query to find your test log entry:
message:"Test log entry from Filebeat"
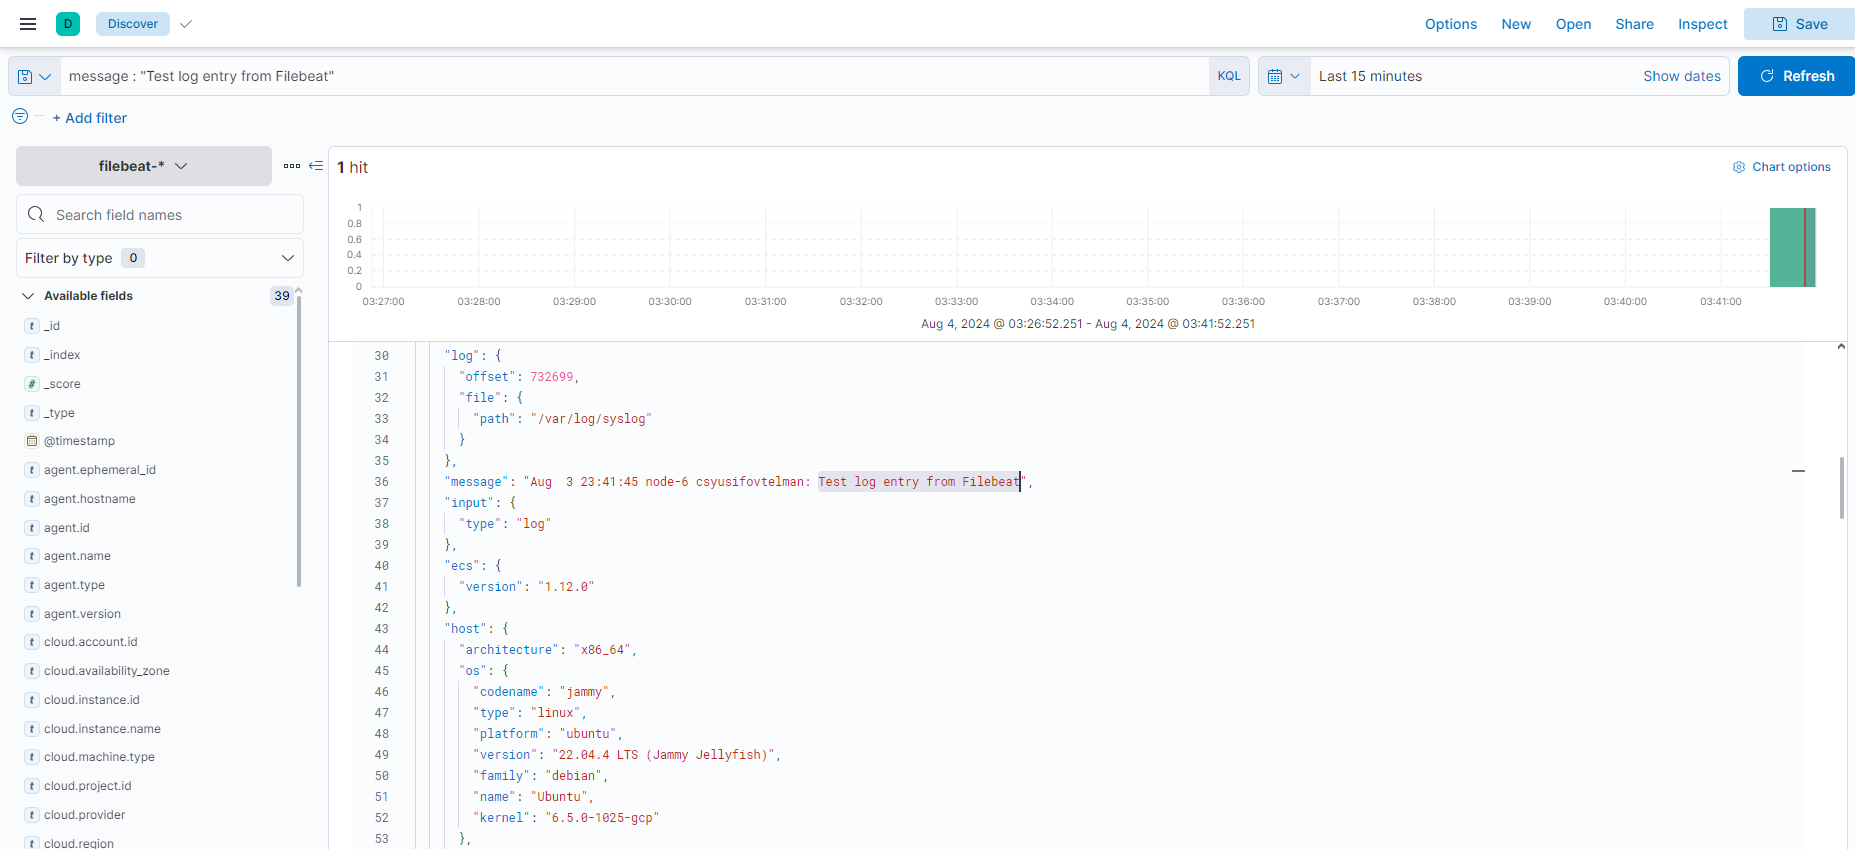
- Ensure the time range in the time picker includes the period when the test log entry was created.
Conclusion
In this tutorial, you’ve learned how to install and configure the High Available Elastic Stack.