Table of contents
Open Table of contents
Introduction
In this post, I’ll demonstrate how to set up a simple connection between an app logger and Elasticsearch.
The stack includes:
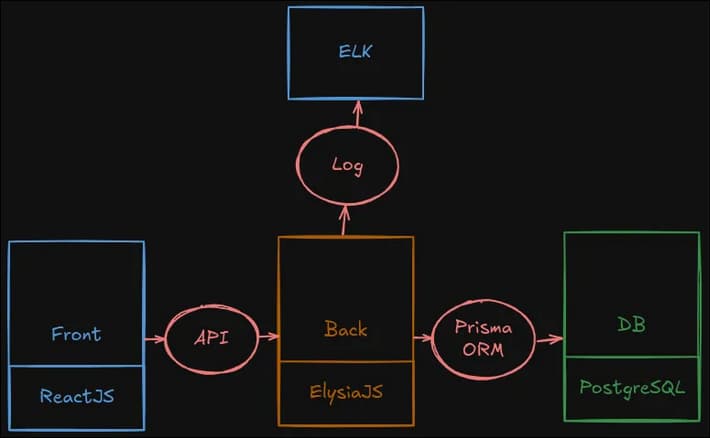
- Frontend: ReactJS
- Backend: ElysiaJS (handles log shipping)
- Database: PostgreSQL
- ELK Stack
We’ll prepare the logger using the winston-elasticsearch package, with the code written in TypeScript.
Link to the repo:
ELK Quick Setup
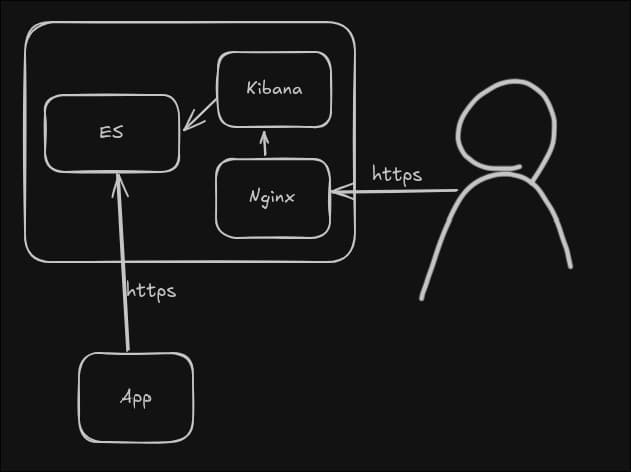
But, first, we need to setup ELK on a server. The parts to be deployed:
- ElasticSearch
- Kibana
- Nginx (in front of Kibana)
Schema:
Packages
Install packages and do not forget to save password (it will be in output at the end)
wget -qO - https://artifacts.elastic.co/GPG-KEY-elasticsearch | sudo gpg --dearmor -o /usr/share/keyrings/elasticsearch-keyring.gpg
echo "deb [signed-by=/usr/share/keyrings/elasticsearch-keyring.gpg] <https://artifacts.elastic.co/packages/8.x/apt> stable main" | sudo tee /etc/apt/sources.list.d/elastic-8.x.list
apt-get update
apt-get install elasticsearch kibana nginx vim > result
# do not forget to save password!
Elasticsearch (ES)
To configure the indexer, follow the steps below:
Setup JVM settings
echo "-Xms1g
-Xmx1g" > /etc/elasticsearch/jvm.options.d/jvm-heap.options
Run the ES
systemctl daemon-reload
systemctl enable --now elasticsearch
Test / Troubleshoot
systemctl status elasticsearch
curl -X GET "https://localhost:9200" --key certificates/elasticsearch-ca.pem  -k -u elastic:password
ss -altnp | grep 9200
tail -f /var/log/elasticsearch/elasticsearch.log
Kibana
To configure Kibana, the dashboard where we are going to analyze logs, follow the steps:
Modify Config
vim /etc/kibana/kibana.yml
# uncomment
server.port: 5601
server.host: "0.0.0.0" # or "localhost", depending on goals
Run the command and save somewhere the enrollment token:
/usr/share/elasticsearch/bin/elasticsearch-create-enrollment-token -s kibana
# it gonna output some base64 - save it
Generate keys and put into config file
/usr/share/kibana/bin/kibana-encryption-keys generate
# output insert into /etc/kibana/kibana.yml
xpack.encryptedSavedObjects.encryptionKey: +-+-
xpack.reporting.encryptionKey: +-+-
xpack.security.encryptionKey: +-+-
run Kibana
systemctl enable --now kibana
Test / Troubleshoot
systemctl status kibana
ss -tulpn | grep 5601
Now, go to Kibana and use token above or generate again, then get verification code from the following command and submit it:
/usr/share/kibana/bin/kibana-verification-code
Nginx (Optional)
In order to proxy Kibana over https, follow the steps:
In Kibana’s config file change the hostname to localhost. And restart the service.
vim /etc/kibana/kibana.yml
# change
server.host: "localhost"

# then
systemctl restart kibana
Prepare Certificates:
# Create a private key
openssl genrsa -out server.key 2048

# Create a certificate signing request (CSR)
openssl req -new -key server.key -out server.csr

# Generate a self-signed certificate
openssl x509 -req -days 365 -in server.csr -signkey server.key -out server.crt
Nginx Config:
vim /etc/nginx/sites-available/kibana
# add
server {
    listen 443 ssl;
    server_name elk.elnurbda.codes; # Replace with your domain or IP

    ssl_certificate /home/devops/nginx-certs/server.crt;
    ssl_certificate_key /home/devops/nginx-certs/server.key;

    location / {
        proxy_pass http://localhost:5601;
        proxy_set_header Host $host;
        proxy_set_header X-Real-IP $remote_addr;
        proxy_set_header X-Forwarded-For $proxy_add_x_forwarded_for;
        proxy_set_header X-Forwarded-Proto $scheme;
    }
}

server {
    listen 80;
    server_name elk.elnurbda.codes;

    return 301 https://$host$request_uri;
}

# then link
ln -s /etc/nginx/sites-available/kibana /etc/nginx/sites-enabled/kibana

# test
nginx -t

# reload
systemctl reload nginx
App Logging
App
This section focuses on the logging setup for the backend application. The logger integrates with Elasticsearch using the winston and winston-elasticsearch packages. Logs are formatted and transported to both local files and an Elasticsearch instance for centralized monitoring and analysis.
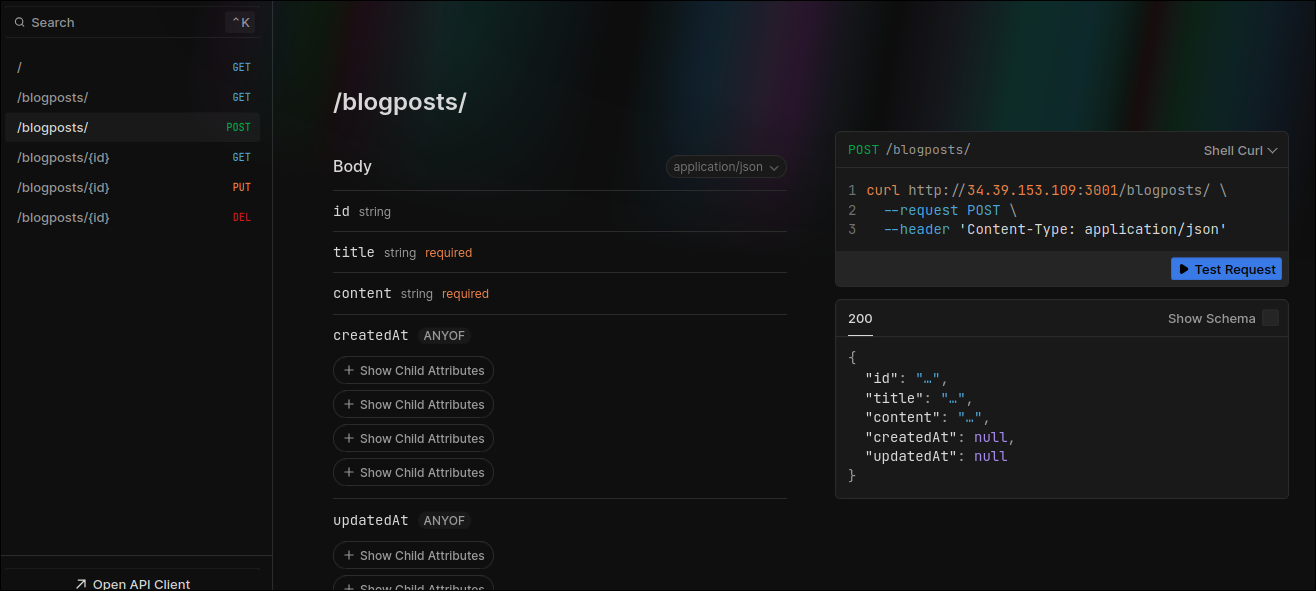
The Project Tree:
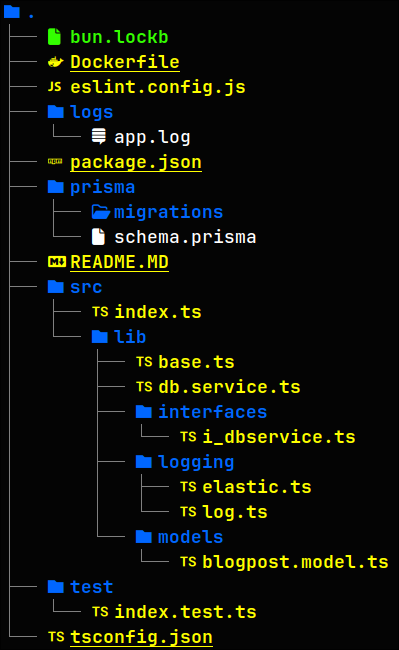
I will not dive into how the Application works, there will be more focus on the Logging Part.
Logger
Packages for Logger
The following packages are essential for this setup:
...
"winston": "^3.17.0",
"winston-elasticsearch": "^0.13.0"
...
Overview
The logger is designed to:
- Log at various levels (debug, info, warn, error).
- Store logs locally in a file.
- Send logs to Elasticsearch, enabling centralized log storage and analysis.
logging/elastic.ts
The log levels are defined as:
const levels = {
  error: 0,
  warn: 1,
  http: 2,
  info: 3,
  debug: 4,
};
The structure of a log entry is defined by the LogData interface:
interface LogData {
  level: string;
  message: string;
  meta: {
    stack?: string;
    data?: any;
  };
  timestamp?: string;
}
The function elasticTransport prepares the configuration for the Elasticsearch transport:
const elasticTransport = (spanTracerId: string, indexPrefix: string) => {
  const esTransportOpts = {
    level: "debug",
    indexPrefix, // the customizable Index Prefix
    indexSuffixPattern: "YYYY-MM-DD",
    transformer: (logData: LogData) => {
      const spanId = spanTracerId;
      return {
        // this data is shiped to ES
        "@timestamp": new Date(),
        severity: logData.level,
        stack: logData.meta.stack,
        message: logData.message,
        span_id: spanId,
        utcTimestamp: logData.timestamp,
        data: JSON.stringify(logData.meta.data),
        ...logData.meta.data, // this line ensures that all fields are shiped separately
      };
    },
    clientOpts: {
      // connection with ES
      maxRetries: 50,
      requestTimeout: 10000,
      sniffOnStart: false,
      node: ENV.ELASTIC_URL || "https://es:9200",
      auth: {
        username: ENV.ELASTIC_USER || "elastic",
        password: ENV.ELASTIC_PASSWORD || "changeme",
      },
      tls: {
        // As our certificates are self-signed
        rejectUnauthorized: false,
      },
      ssl: {
        rejectUnauthorized: false,
      },
    },
  };
  return esTransportOpts;
};
The logTransport function creates and configures the logger with multiple transports:
export const logTransport = (indexPrefix: string) => {
  const spanTracerId = uuidv1(); // ID is unique
  const transport = new transports.File({
    // to save logs additionally insde a file
    filename: "./logs/app.log",
    maxsize: 10 * 1024 * 1024,
    maxFiles: 1,
  });
  const logger = createLogger({
    level: "debug",
    levels,
    format: combine(timestamp(), errors({ stack: true }), json()),
    transports: [
      transport, // Logging into the file
      new ElasticsearchTransport({
        // Logging to the ES
        ...elasticTransport(spanTracerId, indexPrefix),
      }),
    ],
    handleExceptions: true,
  });
  if (ENV.NODE_ENV === "localhost") {
    logger.add(
      new transports.Console({ format: format.splat(), level: "debug" })
    );
  }
  return logger;
};
logging/log.ts
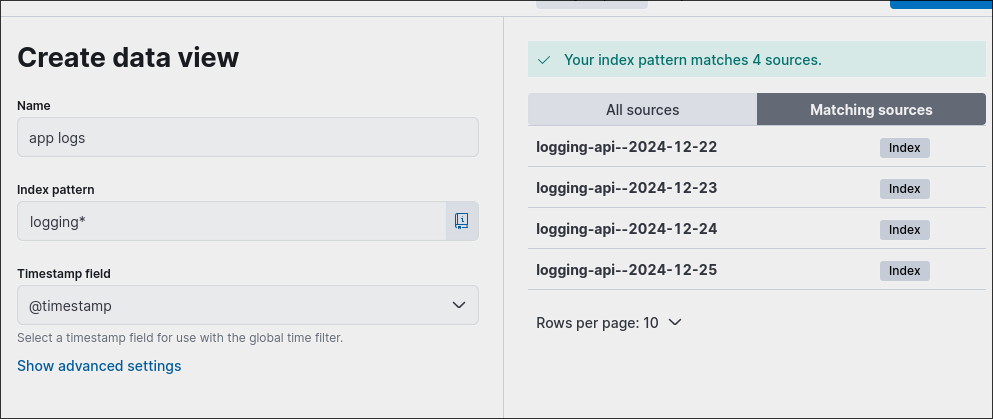
It appends environment-specific suffixes (local, dev, qa, prod) to the base prefix logging-api-.
const ENV = process.env;
let indexPrefix = "logging-api-";
if (ENV.NODE_ENV === "localhost") {
  indexPrefix = indexPrefix.concat("local");
} else if (ENV.NODE_ENV === "DEVELOPMENT") {
  indexPrefix = indexPrefix.concat("dev");
} else if (ENV.NODE_ENV === "QA") {
  indexPrefix = indexPrefix.concat("qa");
} else if (ENV.NODE_ENV === "PRODUCTION") {
  indexPrefix = indexPrefix.concat("prod");
}
All log levels (info, warn, http, error, debug) are handled through consistent methods:
class Logger {
    info(msg: string, data: any) {
        const logger = logTransport(indexPrefix);
        const metaData = { data };
        logger.info(msg, metaData);
    }

    warn(msg: string, data: any) {
        const logger = logTransport(indexPrefix);
        const metaData = { data };
        logger.warn(msg, metaData);
    }
    child(data: any) { // Allows the creation of scoped child loggers for specific use cases.
        const logger = logTransport(indexPrefix);
        const child = logger.child(data);
        child.http('Child logger created');
    }
...
Using Logger in Services
db.service.ts handles interaction with Database. A code snippet that shows how logger is used:
    async getAllBlogPosts() {
        try {
            logger.info('Fetching all blog posts', {});
            const result = await this.prisma.blogPost.findMany();
            logger.info('Fetched all blog posts', { result });
            return result;
        } catch (error) {
            logger.error('Error fetching all blog posts', { error });
            throw error;
        }
    }
Using Logger in Controllers
We need to define a middleware (I defined it inside base.ts):
.guard({ // Logger Middleware
    beforeHandle: ({ request, body, params, headers }) => {
        Logger.http('request', {
            url: request.url,
            method: request.method,
            headers,
            body,
            params
        });
    }, // logs request
    afterHandle: ({ response, set }) => {
        Logger.http('response', {
            response,
            status: set.status
        });
    } // logs response
})
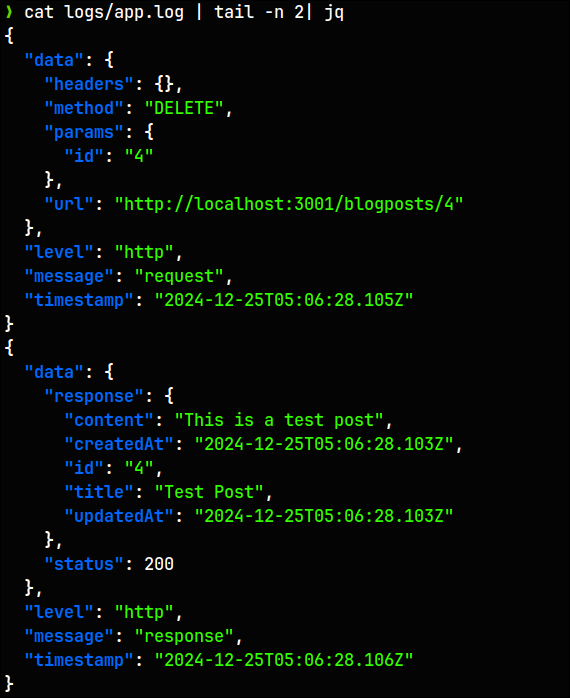
This middleware logs both the requests and the responses.
Log Sample from the file
Dashboard
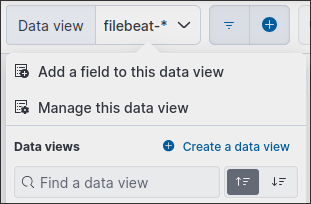
Now, the most interesting part - Visual Representation. First, in order to see App logs, move to Discover Page and create a data view.
Then, enter the prefix and save it.
As a result, you will have a successful log flow:
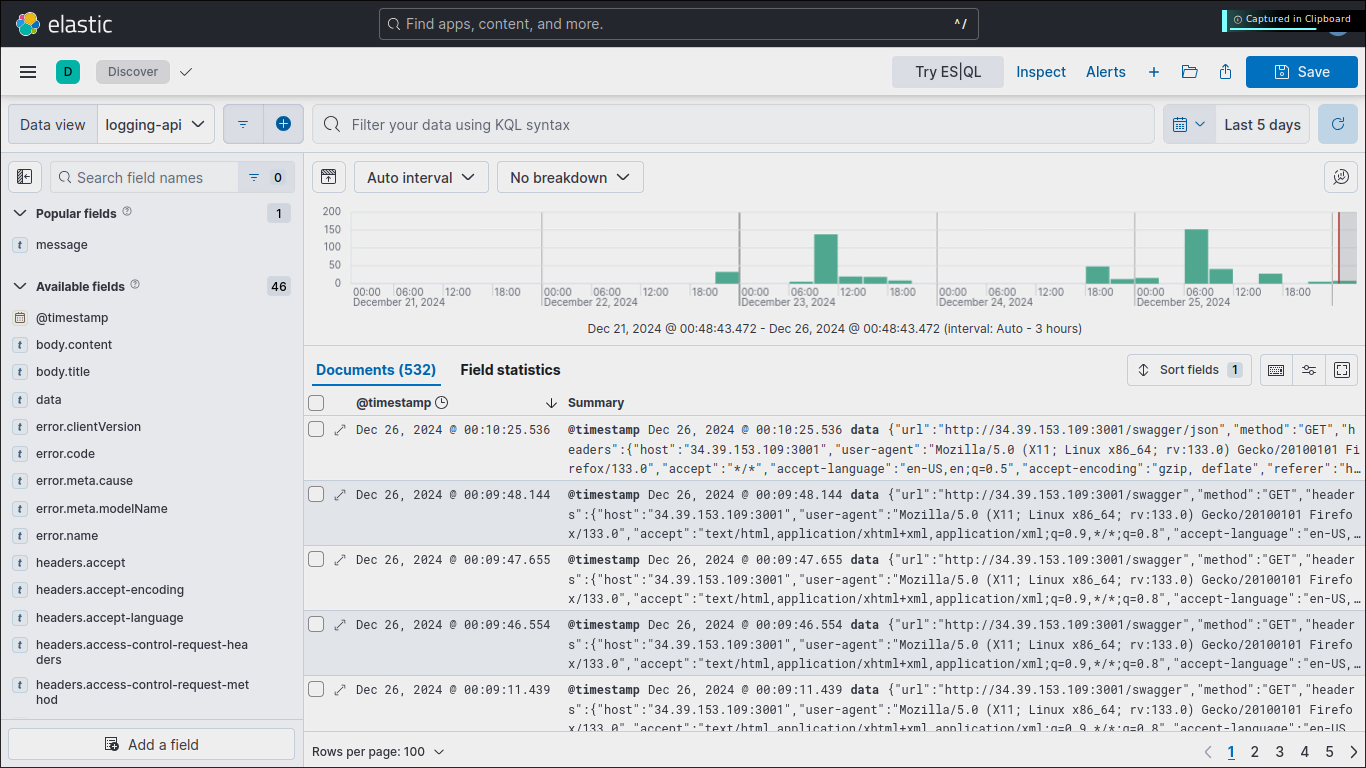
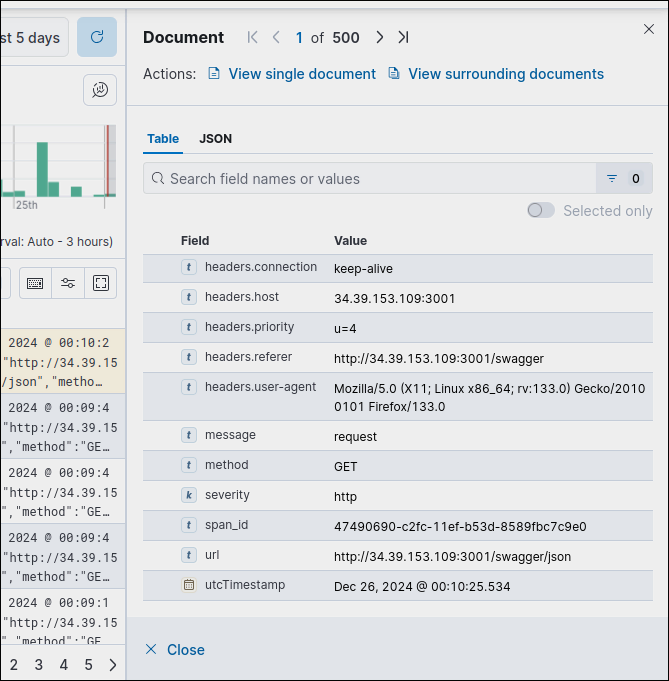
You can analyze the logs, and see multiple fields, they can make a nice statistical information:
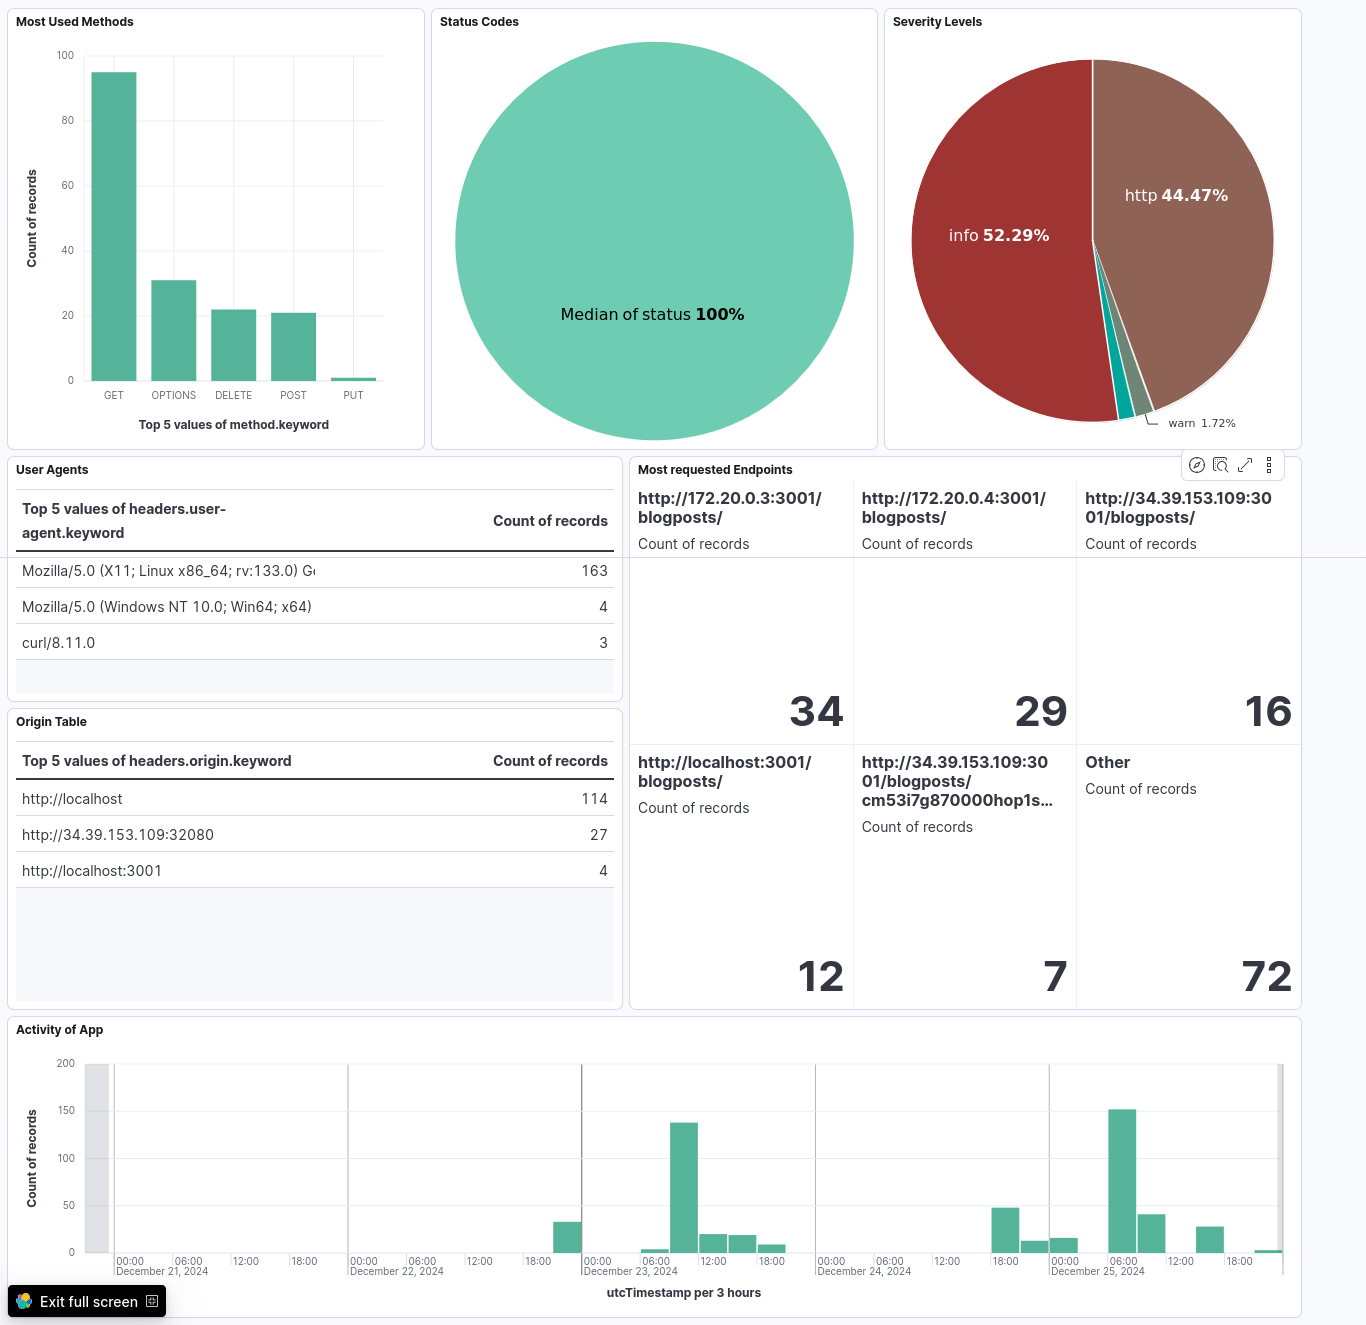
And most importantly, and the most wonderful thing to do - create a Dashboard.
Conclusion
In conclusion, setting up an ELK stack for centralized logging and monitoring can significantly enhance your application’s observability and troubleshooting capabilities. By integrating a logger, you can efficiently capture, store, and analyze logs from your application. This setup not only helps in real-time monitoring but also aids in historical data analysis, making it easier to identify and resolve issues. With the visual representation provided by Kibana, you can gain valuable insights into your application’s performance and behavior, ultimately leading to more robust and reliable software.
However, keep in mind that there is also another method of achieving this result: Instead of sending Logs directly from app to ES, you can collect logs to a certain file and ship it via filebeat.
